
Running Smarter in Production on Amazon EKS: Architecture, Security, Cost and Scale

Smarter’s production environment is a Helm release on Amazon EKS, in a VPC that Terraform builds, fed by a GitHub Actions pipeline that ships every merge to main. This post is a tour of that environment for people who run Kubernetes for a living. It covers what runs, who talks to it, how it’s configured, how it’s secured, what keeps it up, what it costs per month, how it scales and what you have to manage it with.
Everything here comes from three public repositories and a running cluster. The Terraform lives in smarter-infrastructure. The Helm chart, the Dockerfile and the GitHub Actions workflows live in smarter, under helm/charts/smarter and .github. The numbers come from the production namespace as it ran this morning, read with kubectl and k9s. Where the environment makes a tradeoff you might not, I say so, because you’ll find it anyway the first time you read the Terraform.
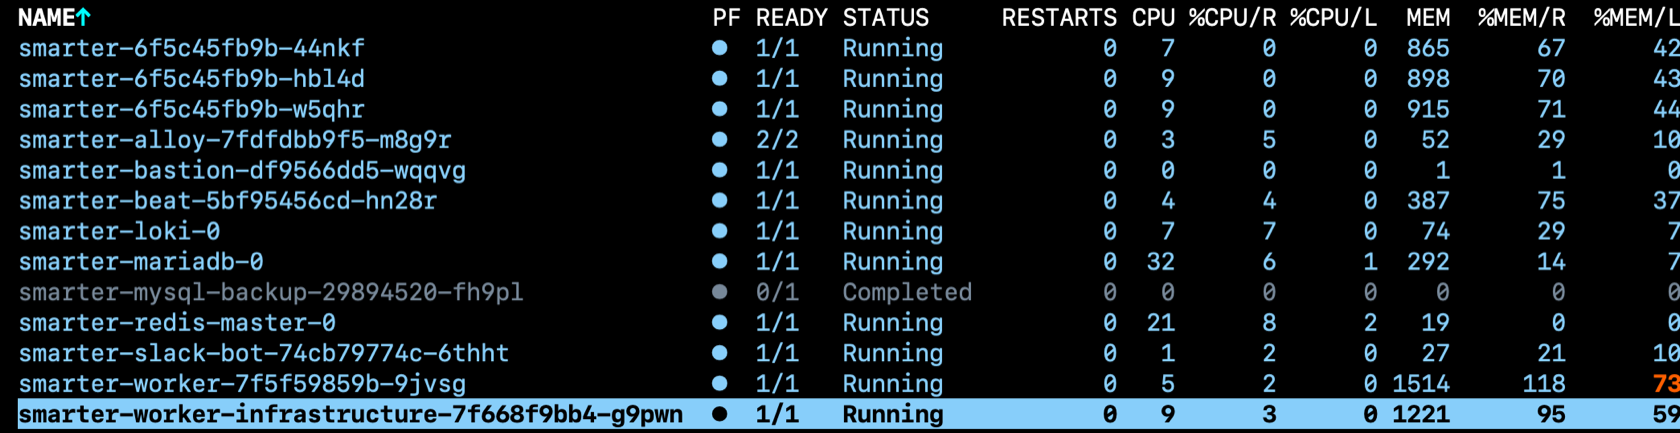
What runs, at a glance
The production namespace holds thirteen pods. Five are the Smarter application itself, built from one container image and started with different commands. The rest are backing services and operational helpers.
| Workload | Kind | Replicas | Requests | What it does |
|---|---|---|---|---|
| smarter | Deployment + HPA | 3 to 25 | 1 CPU, 1280Mi | uvicorn serving Django over ASGI on port 8000 |
| smarter-worker | Deployment + HPA | 1 to 25 | 250m, 1280Mi | Celery, the default queue (prompts, charges, budgets, tools) |
| smarter-worker-infrastructure | Deployment | 1 | 250m, 1280Mi | Celery, the infrastructure queue (DNS, Ingresses, certificates) |
| smarter-beat | Deployment | 1 | 100m, 512Mi | Celery Beat, with RedBeat as the scheduler |
| smarter-mariadb | StatefulSet | 1 | 500m, 2Gi | Bitnami MariaDB, 8Gi gp3 volume |
| smarter-redis-master | StatefulSet | 1 | 250m, 2Gi | Bitnami Redis, standalone |
| smarter-loki | StatefulSet | 1 | 100m, 256Mi | Grafana Loki, single binary, 72 hours of pod logs |
| smarter-alloy | Deployment | 1 | 60m, 178Mi | Grafana Alloy, tails and redacts pod logs into Loki |
| smarter-bastion | Deployment | 1 | 50m, 128Mi | a shell for operators, reached only with kubectl exec |
| smarter-slack-bot | Deployment | 1 | 50m, 128Mi | the project’s Slack bot, in Socket Mode |
| smarter-mysql-backup | CronJob | nightly | mariadb-dump to a private S3 bucket |
Around the namespace, Terraform builds the rest. It creates a VPC of 192.168.0.0/20 across three availability zones in ca-central-1, with public, private and intra subnets, one NAT gateway and a free S3 gateway endpoint. It creates an EKS 1.36 cluster with a managed node group of spot instances, from 3 to 15 nodes. It installs Traefik behind a Network Load Balancer, cert-manager, Calico in policy-only mode, the Cluster Autoscaler, the descheduler and metrics-server. Outside the cluster sit ECR (with a pull-through cache), S3 and CloudFront for static assets, SES for email, Route53 for every hostname, and a private, versioned S3 bucket for database dumps.
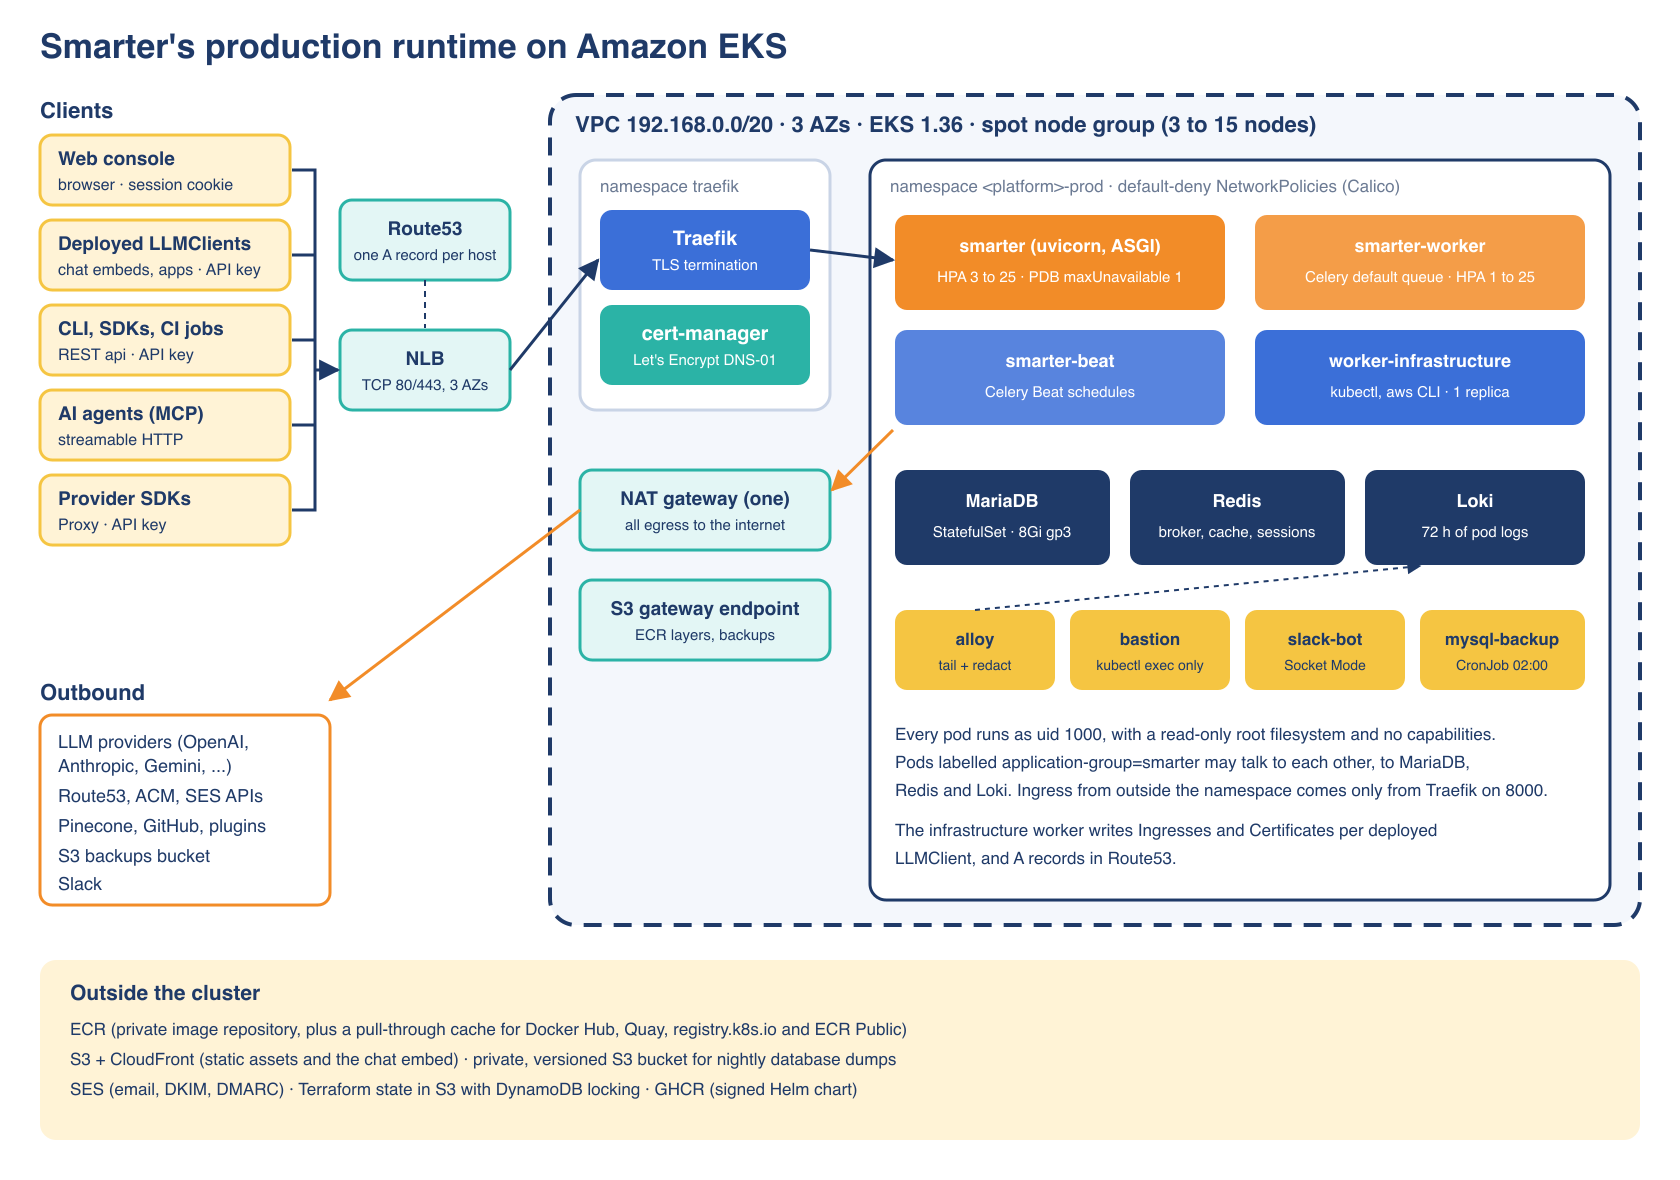
There is no RDS and no ElastiCache. MariaDB and Redis run in the namespace as Bitnami subcharts. That’s a deliberate cost decision, and I come back to what it costs in resilience below.
Who the clients are
Smarter is one Django application that answers on several hostnames, and its clients are quite different from one another. All of them arrive the same way, over HTTPS, through the NLB and Traefik, at the same smarter pods. What differs is the hostname, the authentication and the shape of the traffic. django-hosts routes each hostname to its own URL configuration, which is defined in smarter/hosts.py.
| Client | Hostname | Authentication | Traffic |
|---|---|---|---|
| People in the web console | platform.<domain> | Django session (in Redis), CSRF, password or Google, GitHub or LinkedIn OAuth | page loads, small JSON calls, and chat in the prompt workbench |
| Deployed LLMClients (chatbots) | <name>.<account>.api.<domain>, or a custom domain | a Smarter API key, or none for a public LLMClient | /config/ and /prompt/, long-running LLM calls |
| The CLI, the SDKs and CI pipelines | api.<domain>, or /api/v1/ on the console’s host | a Smarter API key | the REST api, mostly /api/v1/cli/<command>/ |
| AI agents | /api/v1/mcp/... on the console’s host | none for public tools, staff credentials for the operations tools | Model Context Protocol over streamable HTTP |
| Provider SDKs | /api/v1/proxy/... | a Smarter API key in place of the provider’s | passthrough to OpenAI, Anthropic, Gemini and others, including streams |
People in the web console
The web console is server-rendered Django with small React apps mounted in its pages. People use it to write manifests, test prompts in the workbench, manage API keys and watch their charges. They authenticate with a session cookie, and the sessions live in Redis database 2, so any of the app pods can serve any request. Traefik also sets a sticky-session cookie, which helps cache locality but isn’t required. The workbench’s chat calls the same view as a deployed LLMClient, at a sandbox URL on the console’s host, authenticated by the session instead of an API key.
Deployed LLMClients
An LLMClient is Smarter’s word for a configured chatbot or agent (a model, a system prompt, tools, guardrails and so on). When someone deploys one, the infrastructure worker gives it its own hostname, <name>.<account number>.api.<domain>. It creates an A record for it in Route53, and an Ingress in the namespace with a cert-manager.io/cluster-issuer annotation, so cert-manager obtains a Let’s Encrypt certificate for that one host. There’s no wildcard record and no wildcard certificate. A hostname that Smarter didn’t create doesn’t resolve.
What calls these hostnames is software that someone outside the project wrote or embedded. Most often that’s Smarter Chat, the React chat component, dropped into a web page with a script tag, or through the WordPress, Drupal, Shopify or Google Tag Manager integrations. It can also be any application that POSTs to /prompt/. Each request is authenticated with one of the LLMClient’s API keys. An LLMClient with no active key is public, and its prompts are billed to its owner, which operators should make sure their users understand. CORS is enforced by Django from each LLMClient’s allowedOrigins, not by Traefik.
All deployed LLMClients run in the same smarter pods. Deploying one adds routing (a DNS record, an Ingress, a Certificate and a TLS Secret), not compute.
The CLI, the SDKs and automation
The smarter CLI (Go), the Python, Node.js and Go SDKs and the VS Code extension all speak the REST api. Most of what they do goes through /api/v1/cli/<command>/, where the command is apply, get, describe, delete, deploy and so on, with a YAML manifest in the body. This is how teams keep their Smarter resources in Git and apply them from CI, the same way you’d apply Kubernetes manifests. Each platform publishes its whole api as one OpenAPI 3.1 document at /docs/openapi.json, which is what the SDKs are generated against.
AI agents and provider SDKs
The platform’s MCPServer is mounted under /api/v1/mcp/. Its public tools let any agent, Claude Code for example, search and read the project’s code, docs and blog. Its staff-only tools let the people who run the platform query Loki and the EKS control plane from a chat (more on those below). The Smarter Proxy, under /api/v1/proxy/, lets an application use a provider’s own SDK with a Smarter API key instead of the provider’s key, so the provider key never leaves the cluster and every call is metered.
One client that lives inside the cluster
The Slack bot is a client too. It runs in the namespace, holds an outbound Socket Mode connection to Slack, and answers each message by calling a deployed LLMClient’s public URL, the same way an outside app would. It needs no Service, Ingress or certificate.
So, from the cluster’s point of view, nearly all inbound traffic is HTTPS to one Service on port 8000, and the clients differ only in hostname, credentials and how long their requests take. The long ones are LLM calls, which is why the app pods’ sizing is about concurrency rather than CPU.
How it’s configured
Terraform and Terragrunt
smarter-infrastructure is Terragrunt over local modules, with state in S3 and locking in DynamoDB. aws/global.hcl is the only file that reads the operator’s .env, and it derives every name and tag from a handful of values (platform name, subdomain, region, a unique id). The stacks are applied in this order.
aws/stack/vpcaws/stack/kubernetes(EKS, the node groups, add-ons, Calico, the Cluster Autoscaler, the ECR pull-through cache)aws/stack/kubernetes_ingress,kubernetes_cert_managerandkubernetes_descheduler, in any orderaws/environments/<env>, one per environment (hosted zones, the ClusterIssuer, Traefik middlewares, buckets, CloudFront, SES, network policies and the Kubernetes Secrets that hold generated passwords)
Providers are pinned through lock files (aws 6.70, helm 3.3, kubernetes 3.4), and so are the Helm charts that matter. Traefik is pinned at chart 39.0.7 after an unpinned apply once jumped it three major versions. One VPC and one cluster serve every environment, with an environment per namespace.
The Helm chart and smarter_settings
The application’s configuration is environment variables, validated at startup by smarter_settings, a frozen, strict Pydantic Settings object that is the only place in the code that reads configuration. Variables can be prefixed with SMARTER_ or not. A value that starts with SET-ME is treated as missing, and outside a developer’s laptop Smarter refuses to start without a real SECRET_KEY. ENVIRONMENT (alpha, beta, next or prod) picks the Django settings module, and the domains, namespace and allowed hosts are derived from ROOT_DOMAIN and PLATFORM_SUBDOMAIN.
The Helm chart renders its whole env map into one Secret, smarter-env, and every Smarter pod loads it with envFrom. Each pod template carries a checksum/env annotation, so changing any value rolls the pods. Redis is split by database number (the Celery broker and RedBeat in 0, the cache in 1, sessions in 2), so clearing the cache can’t drop queued tasks or log anyone out.
How a release reaches the cluster
The infrastructure changes rarely and is applied by a person. The application changes several times a day and is applied by GitHub Actions.
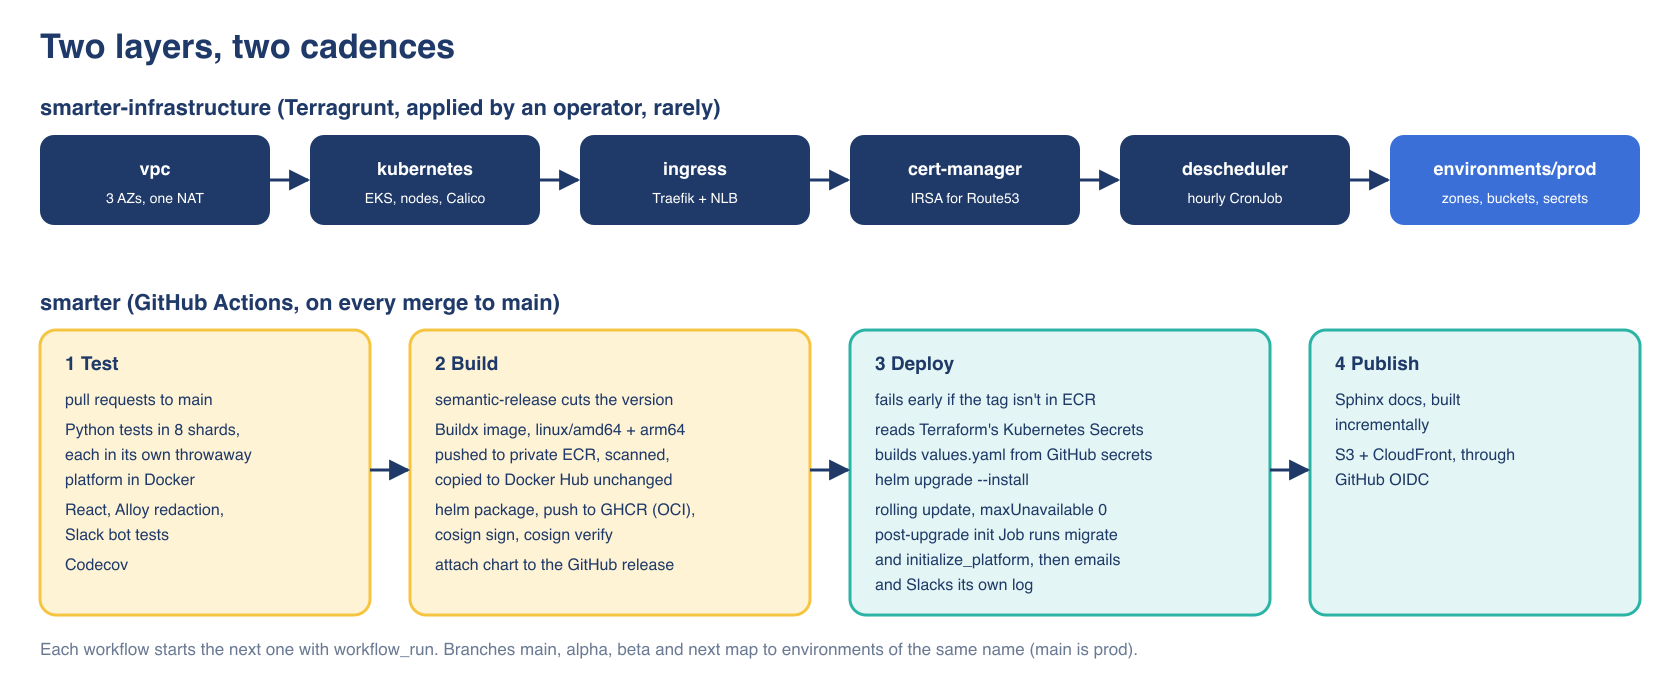
The four workflows chain with workflow_run.
- Test runs on pull requests to main. The Python suite runs in eight shards, each in its own throwaway platform in Docker, alongside the React tests and the tests of Alloy’s redaction rules.
- Build runs semantic-release, builds the image for linux/amd64 and linux/arm64 with Buildx, pushes it to a private ECR repository, triggers a scan, and copies it to Docker Hub without rebuilding it. It packages the Helm chart, pushes it to GHCR as an OCI artifact, and signs and verifies it with cosign. (The supply-chain post covers what that signature does and doesn’t prove.)
- Deploy checks that the image tag exists in ECR before it touches the cluster, reads the passwords that Terraform stored in Kubernetes Secrets, assembles a values file from GitHub secrets, and runs
helm upgrade --install. Apost-upgradehook Job then runsmanage.py migrateandmanage.py initialize_platform, and emails and Slacks its own log. - Publish builds the Sphinx docs and pushes them to S3 and CloudFront, authenticating with GitHub OIDC.
Branches map to environments of the same name, and main is prod. Every initialization step, from seed data to example resources, lives in initialize_platform, never in the chart, the Makefile or a workflow, so a fresh namespace and an upgraded one end up the same.
How security works
Security here is layered, and each layer assumes the one outside it can fail.
The edge
The NLB is the only thing with a public listener. It forwards TCP 80 and 443, with proxy protocol, to Traefik, which terminates TLS. Every certificate comes from Let’s Encrypt through cert-manager, using the DNS-01 challenge against Route53, and cert-manager’s AWS access comes from an IRSA role scoped to Route53 changes. Every Ingress redirects HTTP to HTTPS. Since every hostname has its own record and certificate, there’s no wildcard for a subdomain takeover to hide behind. EC2 instances have no SSH.
Inside Django, every api is rate limited (600 requests a minute per user and 120 per anonymous IP, by default), and custom middleware blocks probes for files like .env and .git, throttles clients that collect too many 404s, and tightens CSRF and CORS for the chat endpoints. There’s no AWS WAF in front of the NLB.
The network
Node security groups do coarse filtering. The EKS module’s recommended rules are turned off and replaced with explicit ones, including an egress allow-list of the ports the platform needs (443, 80, 53, 123, 3306 and SMTP).
Inside the cluster, Calico enforces Kubernetes NetworkPolicies, and the production namespace starts from default-deny-all for both ingress and egress. Every pod in the chart carries the label app.kubernetes.io/application-group=smarter, and the policies are written against that label. Pods in the group may reach each other, MariaDB on 3306, Redis on 6379, Loki on 3100 and 9095, and DNS. From outside the namespace, only the traefik namespace may connect, and only on port 8000. MariaDB and Redis accept connections only from the group. A pod without the label can’t reach the data tier at all. The Calico post goes through the policies one by one.
The pods and the image
Every pod runs as uid 1000 with runAsNonRoot, readOnlyRootFilesystem, allowPrivilegeEscalation: false, all capabilities dropped and the RuntimeDefault seccomp profile. The few paths that must be writable (/tmp, the kubeconfig, Celery’s state) are emptyDirs. In the image, the application code is owned by root and readable, not writable, by the app’s group, so even a process that escaped the read-only filesystem couldn’t change the code.
Identities and secrets
The bastion, Alloy and the Slack bot get no service-account token at all, or a Role limited to their own namespace. Alloy can only read pods and pod logs in its namespace.
The app’s own AWS identity is the part I’d change first. Today the app and its workers use a static IAM access key from smarter-env, not IRSA. That key, the database passwords, the Django secret key, the Fernet key that encrypts Smarter’s own Secret resources, and the LLM providers’ API keys are all in that one Kubernetes Secret, so anyone with get secrets in the namespace can read them. Treat RBAC on the namespace accordingly. The same identity runs kubectl from the infrastructure worker, so give it the least RBAC the platform needs, which the operations guide lists verb by verb.
Logs at rest
Before a log line reaches Loki, Alloy replaces email addresses, IP addresses, bearer tokens, API keys, AWS key ids, GitHub and Slack tokens, JWTs and passwords with placeholders. Mind you, none of those things are expected to ever exist in the logs in the first place, so this is more a “belt & suspenders” precaution than an actual operational security backstop. Those rules have their own tests in CI. Loki has no authentication, and only pods of the namespace can reach it.
What makes it resilient
Spread, budgets and probes
The node group spans three availability zones, and the Cluster Autoscaler runs with balance-similar-node-groups. The app never runs fewer than three replicas. Its rolling update uses maxSurge: 1 and maxUnavailable: 0, and a PodDisruptionBudget allows only one app pod, one MariaDB pod and one Redis pod to be evicted at a time.
The app’s probes are split on purpose. /healthz/ is answered by an ASGI middleware before Django loads, and it serves the startup probe (up to 180 seconds) and the liveness probe, so a slow database never makes the kubelet kill a healthy process. /readiness/ goes through Django and its middleware, so a pod that can’t serve requests leaves the Service without being restarted. On shutdown, a five-second preStop sleep lets Traefik stop routing to the pod before uvicorn begins its 30-second graceful shutdown, inside a 45-second grace period.
Spot capacity
Every node is a spot instance, from a list of six instance families with at least 8 GiB of memory (t3, t3a, m4, m5, m5a and m6a, all large). Six families make it unlikely that all of them are reclaimed at once. EKS node auto-repair replaces unhealthy nodes, and the descheduler runs every hour to rebalance pods after nodes come and go. In this morning’s inventory, the three nodes in the platform’s group were 17 to 19 hours old, which is typical. Spot nodes come and go every day, and nobody notices.
That’s why the logs are in Loki. kubectl logs shows nothing of a pod whose node was reclaimed last night. Loki keeps 72 hours, on its own volume.
Work that survives restarts
The Celery workers can be killed at any moment. A cleanly stopped worker returns its reserved tasks to the queue, and Redis redelivers the tasks of a killed one after its visibility timeout. Long infrastructure tasks never sleep. A task that waits 10 minutes for a certificate, or up to 4 hours for DNS to propagate, reschedules itself with a Celery countdown, so a restart in the middle of a deployment delays it but doesn’t lose it.
Backups
At 2 a.m. UTC every night, a CronJob runs mariadb-dump --single-transaction as a read-only backup user. It checks that the dump ends with its completion marker, compresses it, tests the archive, uploads it to a private, versioned, encrypted S3 bucket, and compares the uploaded size with the local one. Then it emails and Slacks the result. A failed backup is loud.
Single points of failure
These are the tradeoffs, stated plainly.
- MariaDB is one pod on one gp3 volume. An EBS volume lives in one availability zone, so if that zone goes down, the StatefulSet can’t move until it comes back, or until you restore last night’s dump somewhere else. Your recovery point objective is up to 24 hours.
- Redis is standalone. Losing it means losing sessions (everyone signs in again) and queued tasks.
- There’s one NAT gateway. If its zone fails, the pods in the other two zones lose outbound internet, which for Smarter means losing the LLM providers.
- Beat is one replica, by design. RedBeat keeps its schedule in Redis.
- The backup bucket has no lifecycle rule yet, so versions accumulate until someone adds one.
- Network policies cover the production namespace only, not alpha.
Each of these trades availability for money, and each has a clear upgrade path (RDS Multi-AZ, ElastiCache, a NAT gateway per zone) if your requirements differ. The data tier is a subchart toggle, and Django doesn’t care where MariaDB runs.
How to cost it
The cluster’s bill comes from a few line items, and most of them are fixed. The table below is for the configuration in this post at its minimum size, in ca-central-1, at 730 hours a month. The prices are approximate list prices at the time of writing. Spot prices move hourly, so check them before you budget.
| Line item | Basis | Per month |
|---|---|---|
| EKS control plane | $0.10 an hour | $73 |
| 3 spot nodes, t3.large class | about $0.031 an hour each | $68 |
| NAT gateway | about $0.05 an hour, plus $0.05 per GB processed | $37 |
| Network Load Balancer | about $0.025 an hour, plus capacity units | $20 |
| Public IPv4 addresses | 4 (the NAT gateway and the NLB in 3 zones), $0.005 an hour each | $15 |
| EBS gp3 | 60 GB of root volumes and 26 GB of PersistentVolumes | $8 |
| Route53, S3, CloudFront, ECR, SES | a few hosted zones, a few GB, light traffic | $5 to $10 |
| Other | $75 | |
| Total | about $300 to $305 |
With on-demand nodes instead of spot, the three nodes cost about $203 instead of $68, and the total is about $435. At the node group’s ceiling of 15 spot nodes, compute is about $340, and the total is about $575.
What decides the node count
Requests, not usage, decide how many nodes you pay for. A t3.large has 1.93 vCPU and about 6.9 GiB allocatable. The production namespace requests about 4.9 vCPU and 12.7 GiB, and three of those vCPU are the app pods’ one-CPU requests. This morning, the five nodes in the cluster were using 6 to 8% of their CPU. The app pods were using under 10 millicores each, and 865 to 915 MiB of memory.
That one-CPU request is generous for an I/O-bound ASGI server whose real work is waiting on LLM providers, and it’s the first value to tune if you want to fit on fewer nodes. Lower it and the HPA’s 75% CPU target, which is measured against the request, scales out sooner, so tune the two together. Memory is the tighter resource. Each uvicorn worker uses about 420 MB at rest, and the HPA scales on memory at 90% of the request as well.
A method for your own estimate
- Start with the fixed costs, which are the control plane, the NAT gateway, the NLB and the public IPv4 addresses. They’re about $145 a month whatever you run.
- Add up the requests of the namespaces you plan to run (
kubectl get pods -o custom-columns=...against a running environment, or the chart’svalues.yaml), divide by the allocatable capacity of your instance type, round up, and multiply by the spot or on-demand price. - Add NAT data processing. Smarter’s egress is mostly LLM api calls, which are small, so this stays low. Image pulls go through the ECR pull-through cache, whose layers come from S3 through the free gateway endpoint, not through the NAT gateway.
- Add environments. Each extra environment shares the cluster, the NLB and the NAT gateway, and adds only its pods’ requests and its volumes.
Two things are left out of that table on purpose. One is LLM usage, which in most installations will be larger than everything above. Smarter records every request’s tokens per account, user, provider and model (see cost accounting), and its Budgets can lock a resource that overspends. The other is any LLMHost you launch to serve your own models, which adds GPU node groups of its own.
Some of the savings above are deliberate. ECR, ECR API and STS interface endpoints were removed because, without private DNS, they cost about $74 a month and carried no traffic. The root volumes are 20 GB, since nodes use about 10. CloudFront uses PriceClass_100. Every resource is tagged with a cost code, the cluster name and the environment, so Cost Explorer can split the bill.
How it scales
There are three levels of scaling, and they respond to different signals.
- Pods. The app’s HPA runs 3 to 25 replicas on 75% CPU and 90% memory, adding up to 100% more pods a minute and waiting five minutes before scaling down. The default Celery worker’s HPA runs 1 to 25 on CPU. Each app pod runs two uvicorn workers with
--limit-concurrency=100, and LLM calls run in a pool of 32 threads, so a pod holds many slow requests at once. - Nodes. The Cluster Autoscaler grows the node group from 3 to 15 when pods can’t be scheduled, balancing across zones, and the descheduler spreads pods back out once new nodes join. Karpenter isn’t used.
- The infrastructure worker scales by hand, on purpose. Its work is bursty and bounded by Route53’s and cert-manager’s speed, not by CPU. Add replicas when its queue stays long, for example right after a fresh install deploys every built-in LLMClient at once.
The data tier scales vertically only. MariaDB and Redis get bigger requests and bigger volumes (the gp3 StorageClass allows expansion), not replicas.
Deployed LLMClients add routing, not compute. Each one adds a Route53 record (the default quota is 10,000 per hosted zone), an Ingress that Traefik keeps in memory, and a certificate. At scale, Let’s Encrypt’s rate limits on new certificates per registered domain matter more than CPU, so deploy LLMClients in batches after restoring into a new cluster.
What you have to manage it with
The usual tools, with guardrails
kubectl and k9s work as you’d expect. For agents and for people who want a safety net, the repository’s smarter-kubectl skill includes a wrapper that runs only read-only kubectl commands and passes --context and -n explicitly, rather than switching your current context. Helm’s history and rollback work on the release as usual.
For a shell, there’s the bastion pod. It runs the platform’s own image with no open port, so access is whatever your IAM and Kubernetes RBAC allow for kubectl exec, and it gets only the database and AWS credentials, not the rest of the platform’s secrets. From there you can run manage.py commands, mariadb, or a backup by hand.
kubectl exec -it -n <platform>-prod deploy/smarter-bastion -- bash
Logs
Loki keeps 72 hours of the app, worker, Beat and MariaDB logs, labelled by component, pod and container. Query it with LogQL from any pod in the namespace.
curl -sG http://smarter-loki:3100/loki/api/v1/query_range \
  --data-urlencode 'query={component="smarter-worker"} |= "ERROR"' \
  --data-urlencode 'since=1h'
Three waffle switches in the Django admin, log_tasks, log_llmclient and log_infrastructure, turn on detailed logging of Celery tasks, LLMClient deployments and every DNS, certificate and Kubernetes call, including the full manifest applied. Every log line of a deployment carries its task id, so you can follow one deployment across its rescheduled checks.
Inventory and commands
The Django admin’s infrastructure resource ledger records every DNS record and Kubernetes resource that Smarter creates and destroys, and a Beat task reconciles it with what actually exists in the namespace every 15 minutes. The management commands an operator reaches for most are deploy_llmclient, undeploy_llmclient, verify_dns_configuration, delete_orphan_dns_records, sync_infrastructure_inventory, reset_cache, set_debug_logging and create_api_key.
Chat with the platform
The operations MCP server gives the platform’s staff, and their AI agents, tools that search Loki and report on the EKS control plane, node groups, add-ons and cluster insights. So “why did yesterday’s 3 a.m. deployment fail?” is a question you can ask Claude Code, which then reads the logs itself.
Automated checks
smarter-sh/automation is a repository of scheduled GitHub Actions workflows with no application code of its own. One of them watches this environment directly. Pod Log Review runs every day at 09:23 UTC against prod. It takes an inventory with kubectl (pods, restarts, events, image tags), then opens a kubectl port-forward to the namespace’s Loki and reads the whole previous day of the app, worker, Beat and MariaDB logs, including those of pods whose spot nodes are long gone. It redacts the logs again, then has Claude Code review them in a checkout of the platform’s code, so each problem is diagnosed against the code that logged it. Claude keeps the platform’s GitHub issues current. It opens an issue for a new problem, comments on an existing one only when it has new evidence, closes one that a merged pull request fixed, and may propose a small fix as a draft pull request. Its cloud access is read-only, and nothing in the cluster is changed. The pod log review post shows what it finds.
The other workflows look after what the environment is built from, and after the community-supported projects around it.
| Workflow | When | What it checks |
|---|---|---|
| Repository Tests | nightly | runs the test suite of every smarter-sh repository on its default branch, the platform’s included, and reports which failed |
| Published Package Health Check | weekly | that the CLI, the SDKs and the chat component on PyPI, npm and the Go module proxy match their GitHub releases, and actually install |
| API Contract Sync | weekly | that the CLI, the SDKs and the VS Code extension carry the latest platform release’s api contract, with a pull request where they don’t |
| Embed Version Sync | weekly | that the WordPress, Drupal, Shopify, Google Tag Manager and docs-site integrations load the latest chat component |
| Secrets Age Review | weekly | which GitHub Actions secrets are older than six months, the deploy pipeline’s AWS keys and LLM provider keys among them |
| Repository and Workflow Security Reviews | weekly | branch protection, secret scanning, Dependabot settings, unpinned actions and workflow token permissions |
| Dependabot Merge | weekly | merges dependency updates whose checks pass, so none of the above rots |
Every job reports to the project’s Slack, and every job has a dry-run input so you can try it on your own fork first. The automations post goes through them in detail. Together with the init Job’s and the backup’s own reports, Slack becomes the place where the environment tells you about itself, every day, without anyone having to ask.
What the Smarter community brings
Everything in this post is open source under the AGPL, including the Terraform. You can read why each decision was made, not just what it is.
- The code and its history. The commit bodies in smarter-infrastructure explain each change and its cost, like the removal of the interface endpoints or the Traefik pin. The architecture decision records explain the bigger choices, among them ADR-003 on Kubernetes and ADR-030 on separate task queues.
- Documentation. Smarter on Kubernetes, LLMClient deployment and Operating Smarter at Scale, with its troubleshooting table and housekeeping checklist.
- A signed Helm chart on GHCR and Artifact Hub, and multi-arch images on Docker Hub.
- Health checks you don’t have to build. The scheduled workflows in smarter-sh/automation test every repository nightly, check that the published packages install, keep the SDKs and integrations in step with the platform, and review the production logs every morning. They’re plain workflows and standard-library Python, so you can fork them and point them at your own environment.
- Agent skills. Both repositories carry the skills that Claude Code uses to work on them, including the read-only kubectl rules, the pod log review routine and the infrastructure safety rules. Point your own agent at them.
- The project’s Slack workspace, where @Smarter Developer answers questions about any of this at any hour. It’s an LLMClient running on the very environment this post describes, and it answers by searching the current code, docs and blog through the public MCP tools. People answer too.
- The public MCP server. Add
https://<your platform>/api/v1/mcp/smarter-project/to Claude Code or any other MCP client, and your agent can search every smarter-sh repository, including smarter-infrastructure, while it helps you adapt it. - Courses. The free course catalog includes micro-courses on Kubernetes, Docker and infrastructure as code that are built on these same repositories.
If you run it differently, with RDS, Karpenter, IRSA for the app or a WAF, the project would like to hear how it went. Several of the single points of failure above are open invitations.
Takeaways
- Read requests before usage. In this environment, the app’s one-CPU request decides the node count far more than traffic does.
- Decide your recovery point objective before you inherit one. In-cluster MariaDB with nightly dumps is cheap, and it means up to a day of data.
- Make the network boundary a label. One
application-grouplabel and a default-deny policy make the allowed paths easy to read and easy to test. - Split health from readiness. Answering liveness before the framework loads keeps the kubelet from killing pods for a slow database.
- Keep logs off the node. On spot capacity, a pod’s logs are gone with its node unless something ships them first.
- Don’t let waits hold workers. Rescheduling with a countdown makes long infrastructure workflows survive restarts.
Closing thoughts
Smarter’s production environment is an ordinary EKS cluster, run carefully and cheaply. It’s a few hundred dollars a month of AWS infrastructure in front of what will usually be a larger bill for LLM tokens, which the platform meters itself. Its tradeoffs are visible in the Terraform, and the community around it is happy to talk about any of them.